Families and Guardians
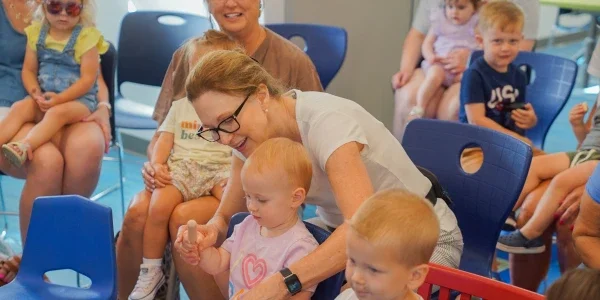
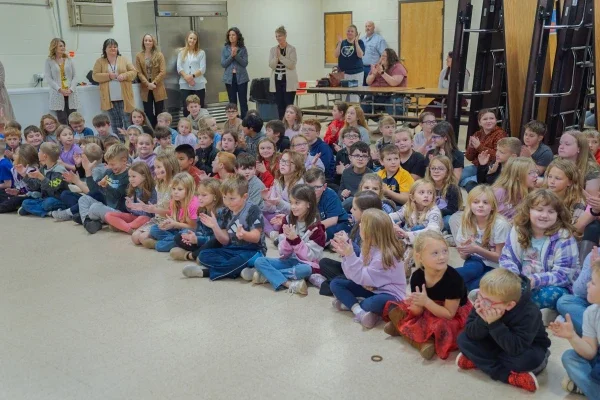
Family engagement is an important part of public schools and student success. These resources support student achievement and development in school and at home.

Learn more about approvals for all licensure permits, authorizations, and certifications for anyone wishing to work within West Virginia public schools.
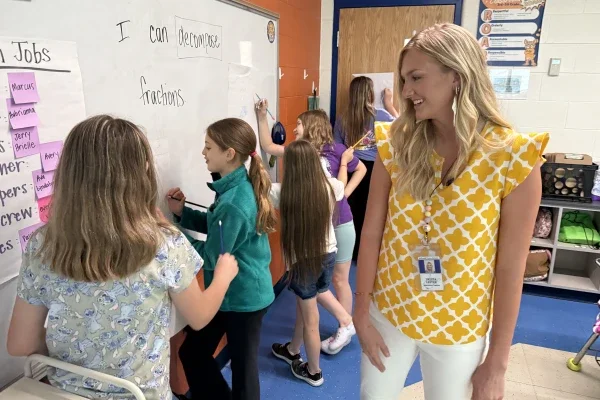
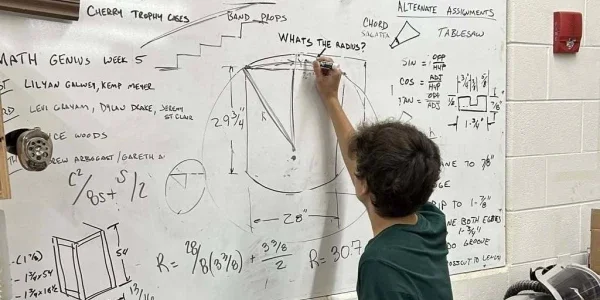
Browse the West Virginia College- and Career-Readiness Standards online.
WVLearns account creation, out-of-state educator access, WV educator course enrollment and course syllabi.
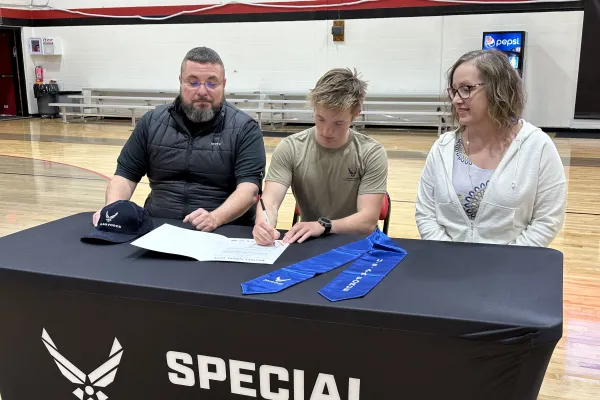
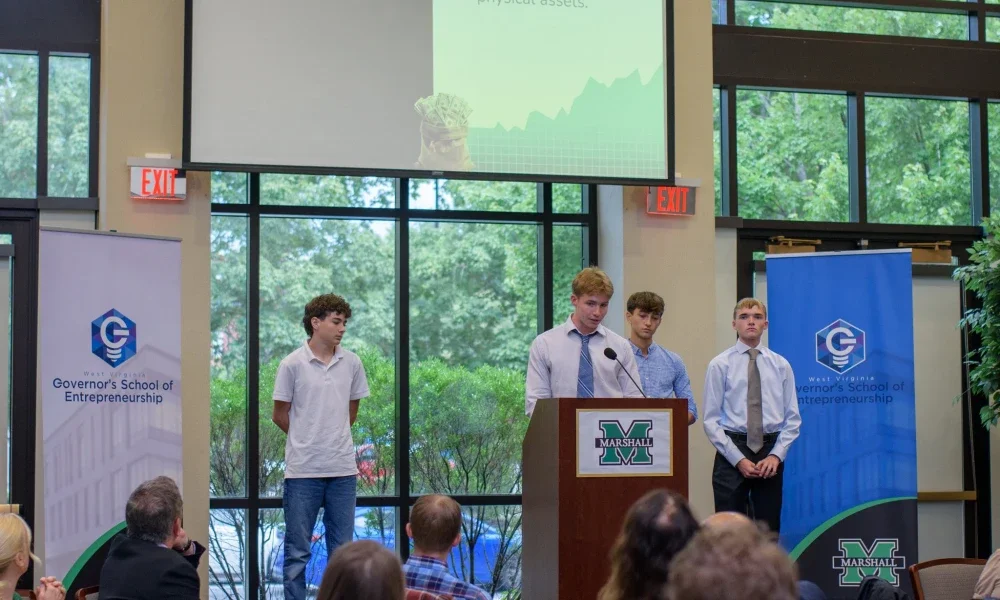
Explore opportunities in West Virginia's public school system.
Dedicated to ensuring that all children have access to nutritious meals that support their well-being and readiness for learning.
Creating pathways of academic and life-long success for all of West Virginia's children.
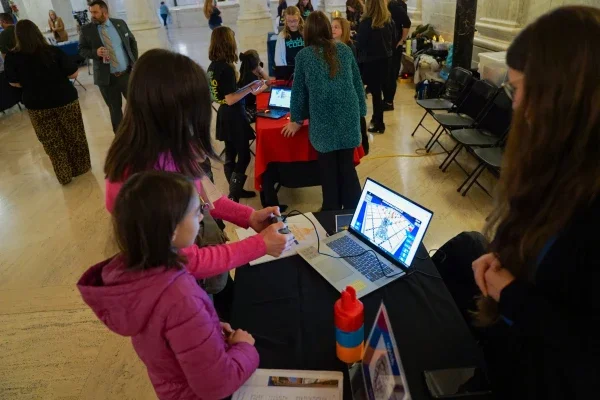
Explore numerous topics that can help students develop career skills.
View high school graduation dates and a summary of county calendar dates.
Academic Program
Academic Program
Academic Program

Academic Program
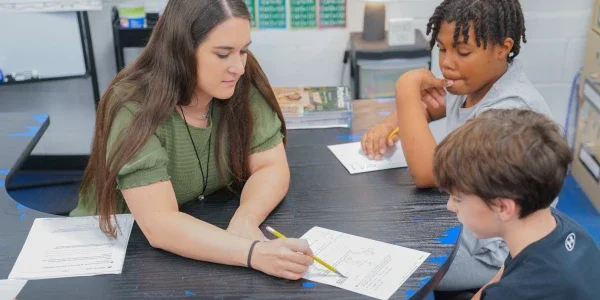
The WVDE seeks to attract individuals from all walks of life who are intelligent, creative, skilled, responsible, and compassionate with a desire to begin educational career paths.